Monitoring Meilisearch performance in Kubernetes cluster using Nginx
You have deployed Meilisearch in Kubernetes cluster. Now what?
I have gone further and added performance monitoring using an existing tool called Nginx. In this setup Nginx acts as a reverse proxy to Meilisearch, it logs requests in the access log and passes it to Meilisearch’s origin. To achieve that I used so-called sidecar containers (which allow you to add custom functionality to running K8s pods).
Let’s dive into this, shall we?
Prerequisites #
Configuration #
Configuration comes in two parts. One is to cover the Nginx container, another for Meilisearch.
custom.yaml
Before deploying the Meilisearch instance we need to apply configuration for the Nginx sidecar.
Below is an example of a configuration file, which includes all required ConfigMap, Service, and ServiceMonitor sections.
# Nginx container configuration (default and vhost)
apiVersion: v1
kind: ConfigMap
metadata:
  name: meilisearch-nginx
  labels:
    app.kubernetes.io/name: meilisearch
    app.kubernetes.io/component: search-engine
data:
  nginx.conf: |
    user  nginx;
    worker_processes  auto;

    error_log  /var/log/nginx/error.log notice;
    pid        /var/run/nginx.pid;

    events {
      worker_connections  1024;
    }

    http {
      include       /etc/nginx/mime.types;
      default_type  application/octet-stream;

      log_format  main  '$http_x_real_ip - $remote_user [$time_local] "$host" "$request" $status $body_bytes_sent "$http_referer" "$http_user_agent" "$http_x_forwarded_for" $request_time $upstream_connect_time $upstream_header_time $upstream_response_time $request_id';

      access_log  /var/log/nginx/access.log  main if=$log_ua;

      sendfile        on;

      keepalive_timeout  65;

      # Add hostname indicating our server
      add_header X-Backend-Server $hostname;

      server {
        listen 80;

        # Allow to send big enough payloads to Meilisearch
        client_max_body_size 100m;

        location / {
          proxy_pass http://localhost:7700/;
          proxy_set_header Host $http_host;
          proxy_set_header X-Real-IP $remote_addr;
          proxy_set_header X-Forwarded-For $proxy_add_x_forwarded_for;
          proxy_set_header X-Forwarded-Proto $scheme;
        }
      }
    }
---
# Nginx metrics exporter configuration
apiVersion: v1
kind: ConfigMap
metadata:
  name: meilisearch-nginx-exporter
  labels:
    app.kubernetes.io/name: meilisearch
    app.kubernetes.io/component: search-engine
data:
  config.hcl: |
    listen {
      port = 4040
    }

    namespace "nginx" {
      source = {
        files = ["/var/log/nginx/access.log"]
      }

      print_log = false

      format = "$remote_addr - $remote_user [$time_local] \"$host\" \"$request\" $status $body_bytes_sent \"$http_referer\" \"$http_user_agent\" \"$http_x_forwarded_for\" $request_time $upstream_connect_time $upstream_header_time $upstream_response_time $request_id"

      labels {
        app_kubernetes_io_name = "meilisearch"
        app_kubernetes_io_component = "search-engine"
        app_kubernetes_io_part_of = "meilisearch"
      }

      relabel "request_uri" {
        from = "request"
        split = 1
        separator = "?" // (1)

        // if enabled, only include label in response count metric (default is false)
        only_counter = false

        // define routes which we are going to track
        match "^(GET|DELETE) /indexes/[a-zA-Z0-9_]+/documents/[a-zA-Z0-9]+.*$" {
          replacement = "/indexes/:index/documents/:document"
        }

        match "^(GET|POST|PUT|DELETE) /indexes/[a-zA-Z0-9_]+/documents.*$" {
          replacement = "/indexes/:index/documents"
        }

        match "^DELETE /indexes/[a-zA-Z0-9_]+/documents/delete-batch.*$" {
          replacement = "/indexes/:index/documents/delete-batch"
        }

        match "^(GET|POST) /indexes/[a-zA-Z0-9_]+/search.*$" {
          replacement = "/indexes/:index/search"
        }

        match "^GET /indexes/[a-zA-Z0-9_]+/stats.*$" {
          replacement = "/indexes/:index/stats"
        }

        match "^(GET|PATCH|PUT|DELETE) /indexes/[a-zA-Z0-9_]+/settings.*$" {
          replacement = "/indexes/:index/settings"
        }

        match "^(GET|PATCH|PUT|DELETE) /indexes/[a-zA-Z0-9_]+/settings/[a-zA-Z0-9_-]+.*$" {
          replacement = "/indexes/:index/settings/:setting"
        }

        match "^(GET|PATCH|DELETE) /indexes/[a-zA-Z0-9_]+.*$" {
          replacement = "/indexes/:index"
        }

        match "^(GET|POST) /indexes.*$" {
          replacement = "/indexes"
        }

        match "^GET /tasks/[a-zA-Z0-9_]+.*$" {
          replacement = "/tasks/:task"
        }

        match "^POST /tasks/cancel.*$" {
          replacement = "/tasks/cancel"
        }

        match "^(GET|DELETE) /tasks.*$" {
          replacement = "/tasks"
        }

        match "^(GET|PATCH|DELETE) /keys/[a-zA-Z0-9_]+.*$" {
          replacement = "/keys/:key"
        }

        match "^(GET|POST) /keys.*$" {
          replacement = "/keys"
        }

        match "^GET /stats.*$" {
          replacement = "/stats"
        }

        match "^GET /health.*$" {
          replacement = "/health"
        }

        match "^GET /version.*$" {
          replacement = "/version"
        }

        match "^POST /dumps.*$" {
          replacement = "/dumps"
        }
      }

      histogram_buckets = [.005, .01, .025, .05, .1, .25, .5, 1, 2.5, 5, 10]
    }
---
# Nginx service
apiVersion: v1
kind: Service
metadata:
  name: meilisearch-nginx
  labels:
    app.kubernetes.io/name: meilisearch
    app.kubernetes.io/component: search-engine
spec:
  ports:
    - port: 80
      targetPort: 80
      name: nginx
  selector:
    app.kubernetes.io/name: meilisearch
    app.kubernetes.io/component: search-engine
---
# Nginx metrics service
apiVersion: v1
kind: Service
metadata:
  name: meilisearch-nginx-metrics
  labels:
    app.kubernetes.io/name: meilisearch
    app.kubernetes.io/component: search-engine
spec:
  ports:
    - port: 4040
      targetPort: 4040
      name: nginx-metrics
  selector:
    app.kubernetes.io/name: meilisearch
    app.kubernetes.io/component: search-engine
---
# ServiceMonitor instructs prometheus monitoring to pickup endpoint
apiVersion: monitoring.coreos.com/v1
kind: ServiceMonitor
metadata:
  name: meilisearch-nginx-metrics
  labels:
    app.kubernetes.io/name: meilisearch
    app.kubernetes.io/component: search-engine
    release: kube-prometheus-stack # label required for monitoring to pick up endpoint, might differ in your setup
spec:
  endpoints:
    - interval: 30s
      port: nginx-metrics
  selector:
    matchLabels:
      app.kubernetes.io/name: meilisearch
      app.kubernetes.io/component: search-engine
values.yaml
Now we need to tweak default the values for the installation process. Here we’ll add volume mounts for Nginx logs and their configurations, and define custom sidecar containers for Nginx and metrics exporter.
image:
  tag: v0.29.3

environment:
  MEILI_ENV: production

volumes:
  - name: meilisearch-nginx
    configMap:
      name: meilisearch-nginx
  - name: nginx-logs
    emptyDir: {}
  - name: meilisearch-nginx-exporter
    configMap:
      name: meilisearch-nginx-exporter

containers:
  # Nginx sidecar container
  - name: nginx
    image: nginx:1.23.1
    resources:
      requests:
        cpu: "10m"
        memory: "16Mi"
    volumeMounts:
      - name: meilisearch-nginx
        mountPath: /etc/nginx/nginx.conf
        subPath: nginx.conf
      - name: nginx-logs
        mountPath: /var/log/nginx
  # Nginx metrics exporter sidecar container
  - name: exporter
    image: quay.io/martinhelmich/prometheus-nginxlog-exporter:v1
    resources:
      requests:
        cpu: "10m"
        memory: "24Mi"
    args: [ "-config-file", "/etc/prometheus-nginxlog-exporter/config.hcl" ]
    volumeMounts:
      - name: nginx-logs
        mountPath: /var/log/nginx
      - name: meilisearch-nginx-exporter
        mountPath: /etc/prometheus-nginxlog-exporter
Applying configuration #
After creating configuration files we need to apply them to K8s cluster. Let’s begin with custom configuration first.
kubectl apply -f ./custom.yaml --namespace=meilisearchAfter custom configuration is applied let’s move to deploy Meilisearch itself.
helm upgrade --install meilisearch meilisearch/meilisearch -f ./values.yaml --namespace=meilisearchGrafana dashboard #
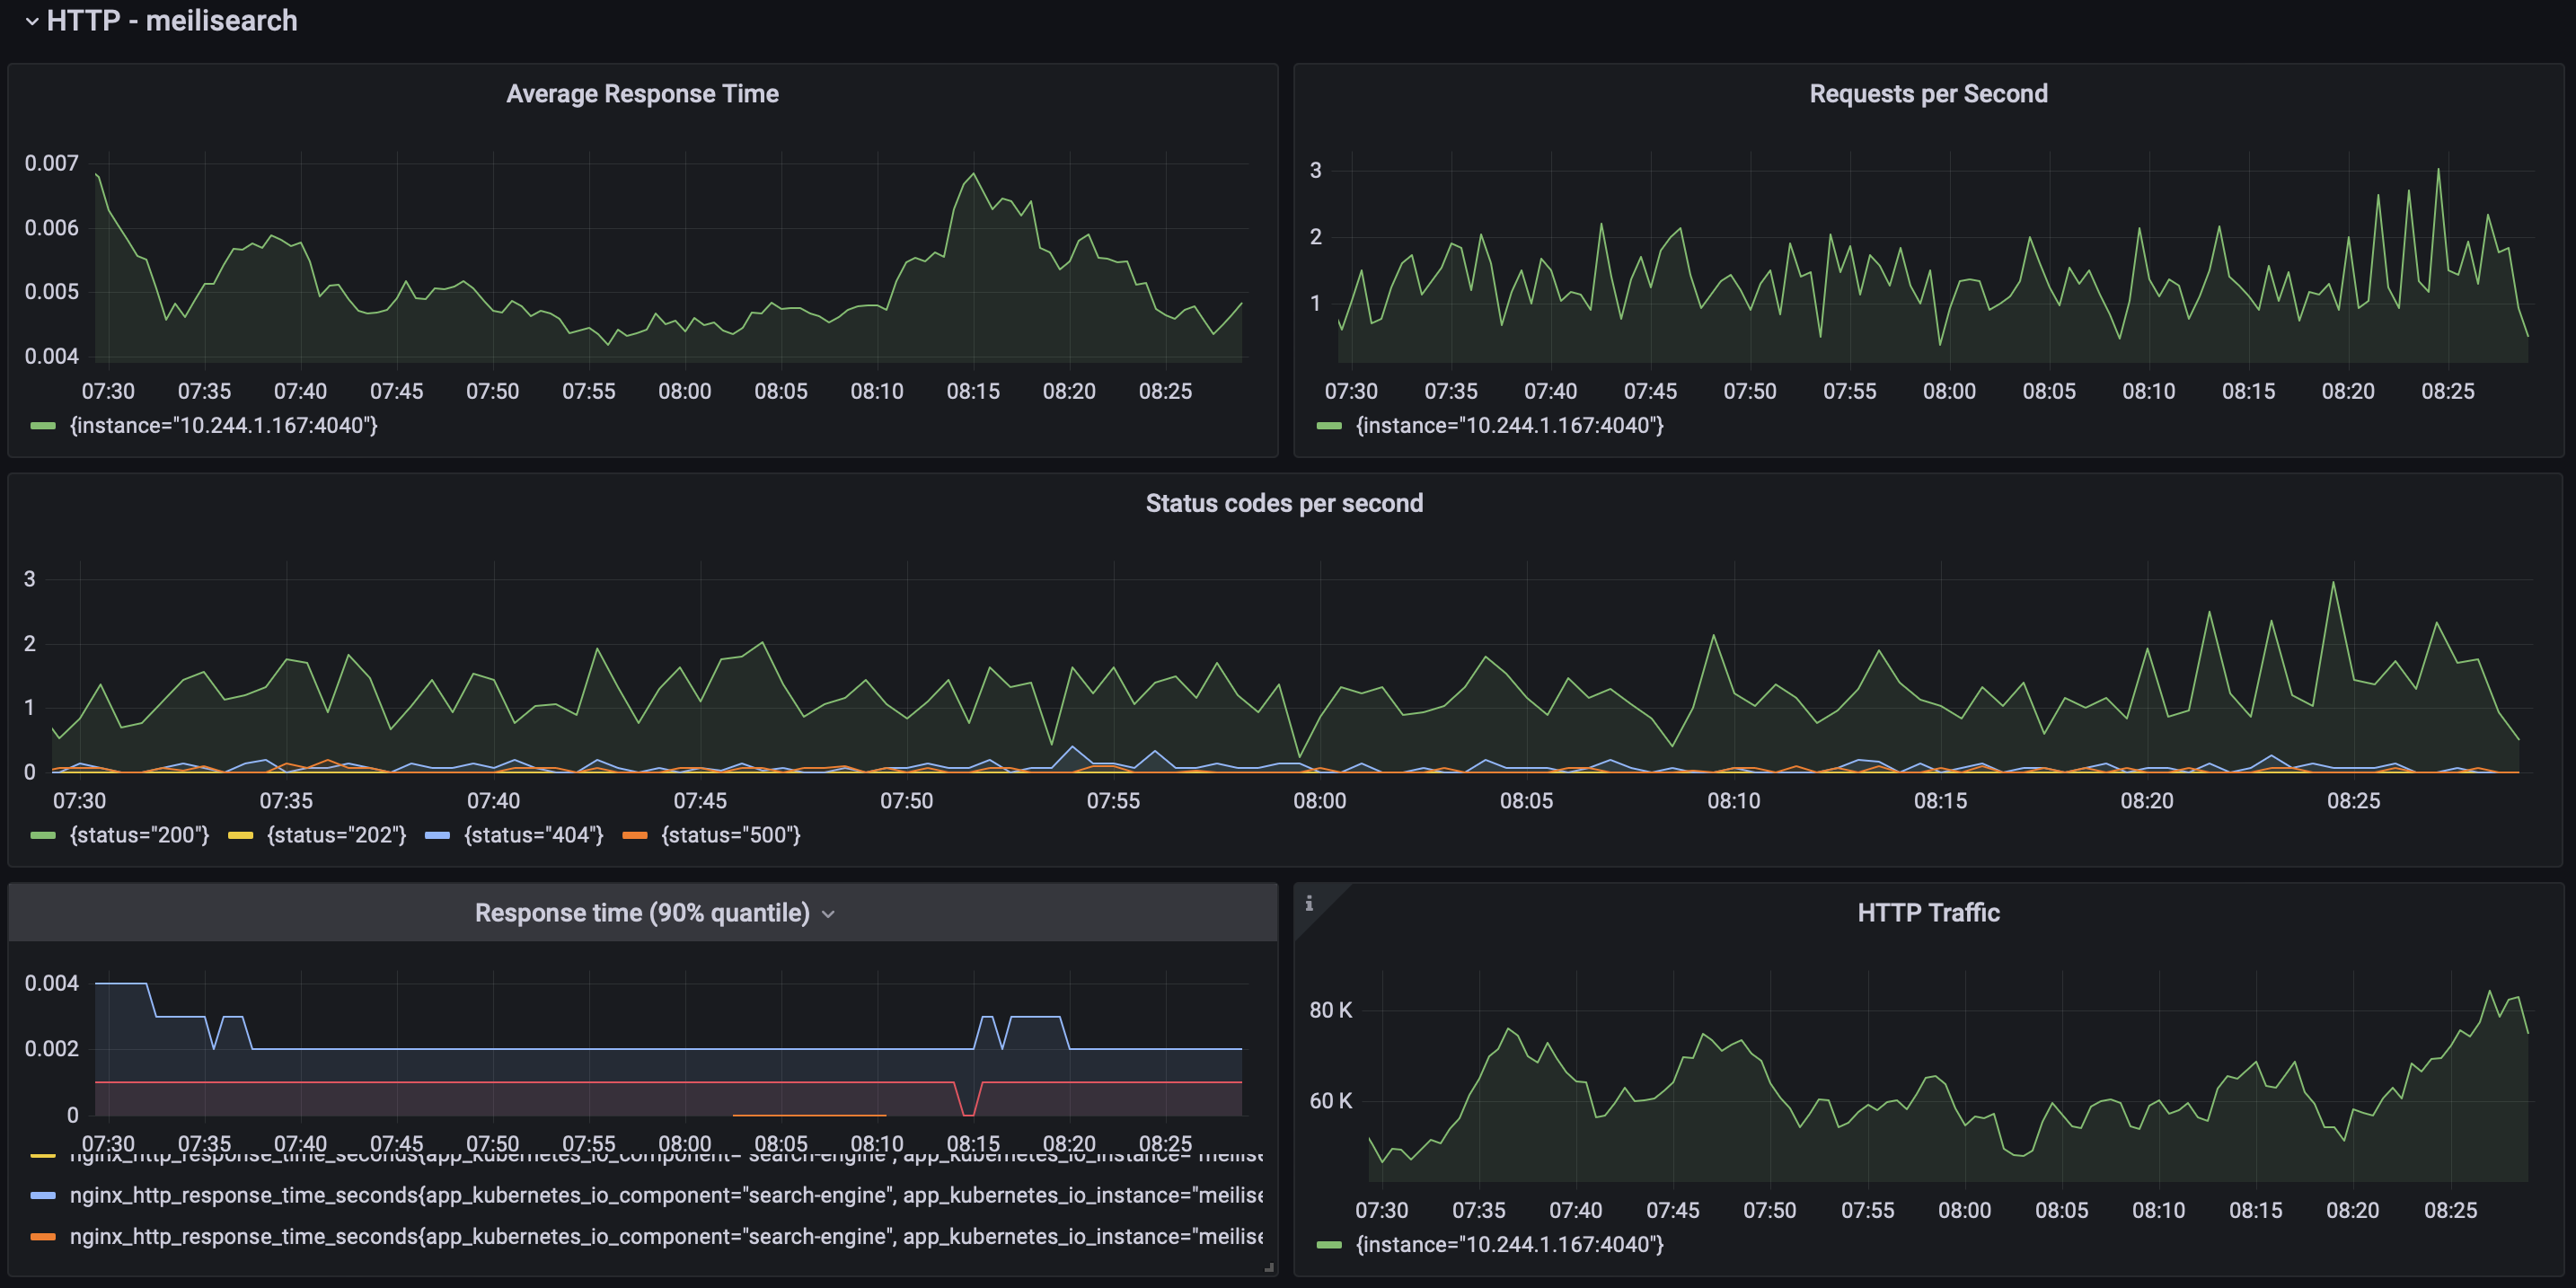
Everything is running now, we can take a look at performance by creating a custom Grafana dashboard, or trying some of the already created ones
This is a preview of the dashboard I use.

Meilisearch Nginx Grafana Dashboard
One more thing #
This pattern could be applied to any of your services, eg. Laravel, golang, or any other application.